Understanding the Ramachandran Plot: A Window into Protein Structure
Learn the Ramachandran Plot — phi (φ) and psi (ψ) angles, allowed regions, and how it validates protein structures and secondary conformations.
BIOTECHNOLOGY
Dr. Mainak Mukhopadhyay
11/9/2025
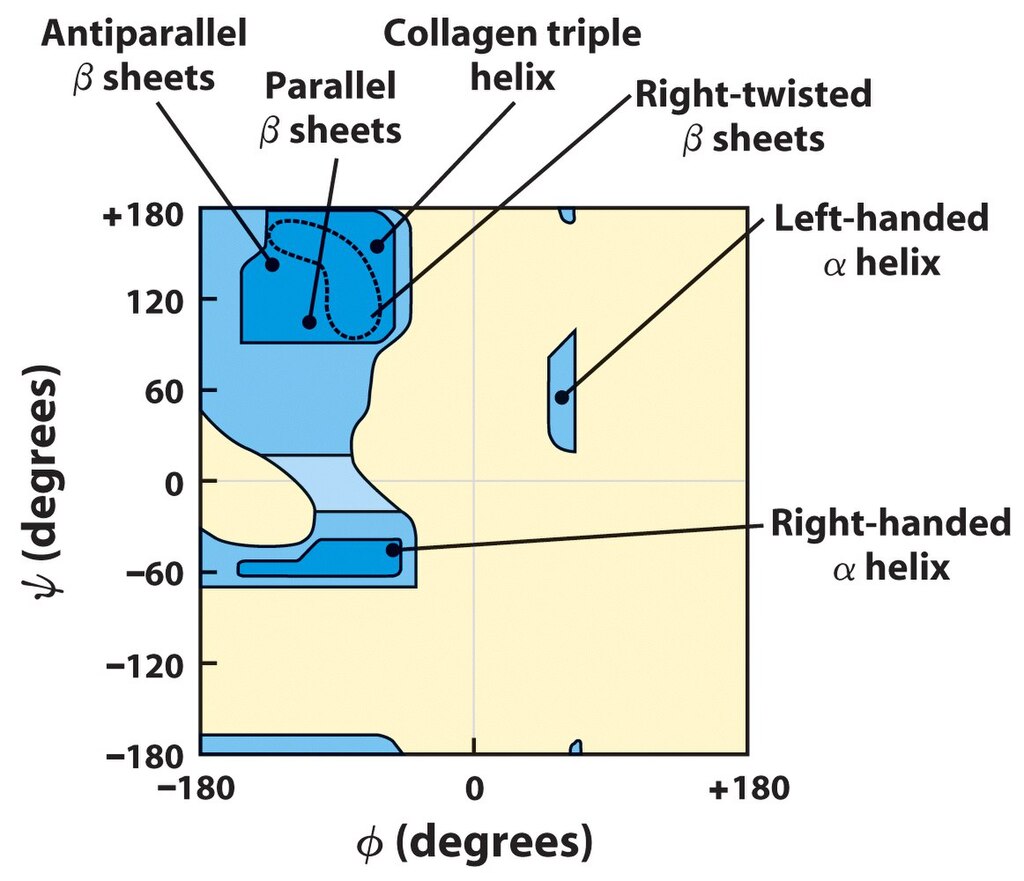
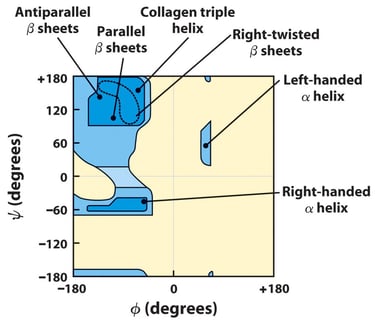
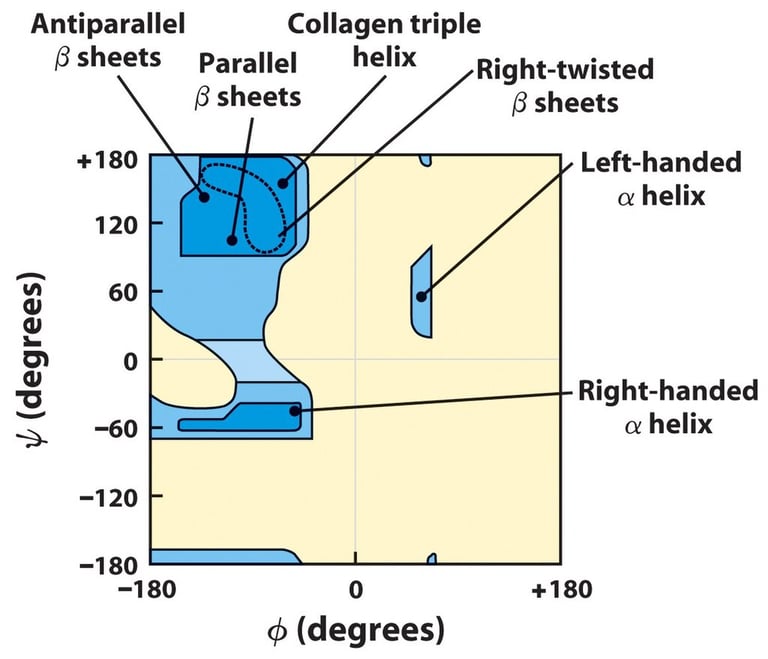
Figure. The Ramachandran plot illustrating the sterically allowed and disallowed regions for backbone dihedral angles (φ and ψ) in proteins. The most favorable regions correspond to α-helices (bottom left) and β-sheets (top left), where atomic clashes are minimized.
Mr. Galviati, CC BY-SA 4.0 <https://creativecommons.org/licenses/by-sa/4.0>, via Wikimedia Commons
Explore
Stay updated with biotech insights and research.
Connect
Discover
m.mukhopadhyay1212@gmail.com
+91-8777294577
© 2025. All rights reserved.