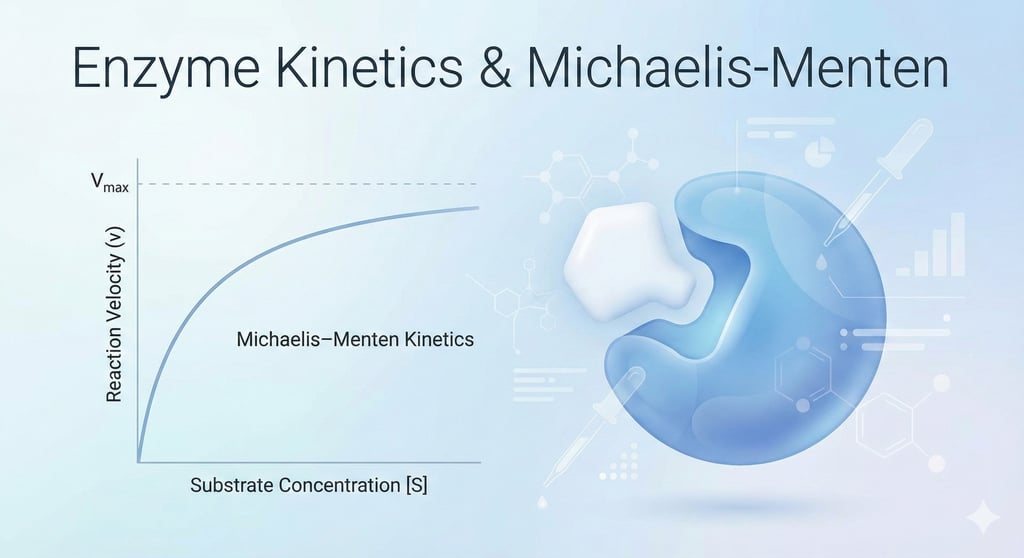
Understanding the Michaelis–Menten Equation: Complete Guide to Enzyme Kinetics
Discover how the Michaelis–Menten equation explains enzyme activity. A complete, easy-to-understand guide with diagrams, plots, examples, and advanced concepts.
BIOTECHNOLOGY
Dr. Mainak Mukhopadhyay
12/1/20251 min read
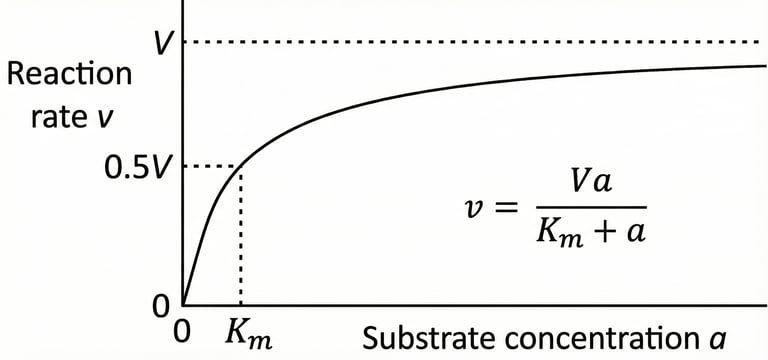
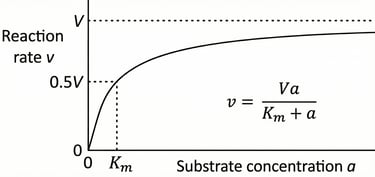
A graphical representation of Michaelis-Menten enzyme kinetics, plotting reaction rate (v) against substrate concentration (a). The hyperbolic curve illustrates how the rate increases with substrate concentration, approaching a maximum velocity (V). The Michaelis constant (Km) is shown as the substrate concentration at which the reaction rate is half of V. The corresponding equation, v = Va / (Km + a), is also displayed.
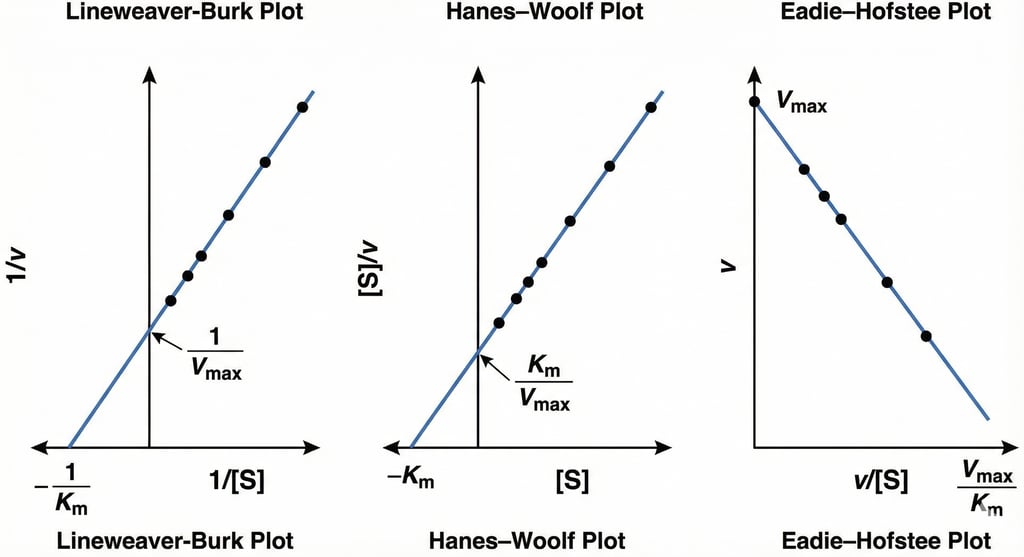
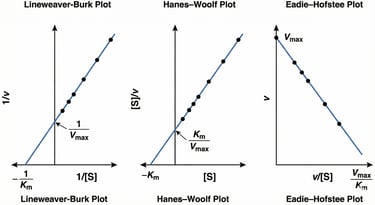
This figure presents three common linearized plots used in enzyme kinetics to determine the kinetic parameters Vmax (maximum reaction velocity) and Km (Michaelis constant). From left to right, the graphs are the Lineweaver-Burk plot (double-reciprocal plot), the Hanes-Woolf plot, and the Eadie-Hofstee plot, each showing how these parameters are derived from the intercepts and slopes of the linear regression lines.
Explore
Stay updated with biotech insights and research.
Connect
Discover
m.mukhopadhyay1212@gmail.com
+91-8777294577
© 2025. All rights reserved.