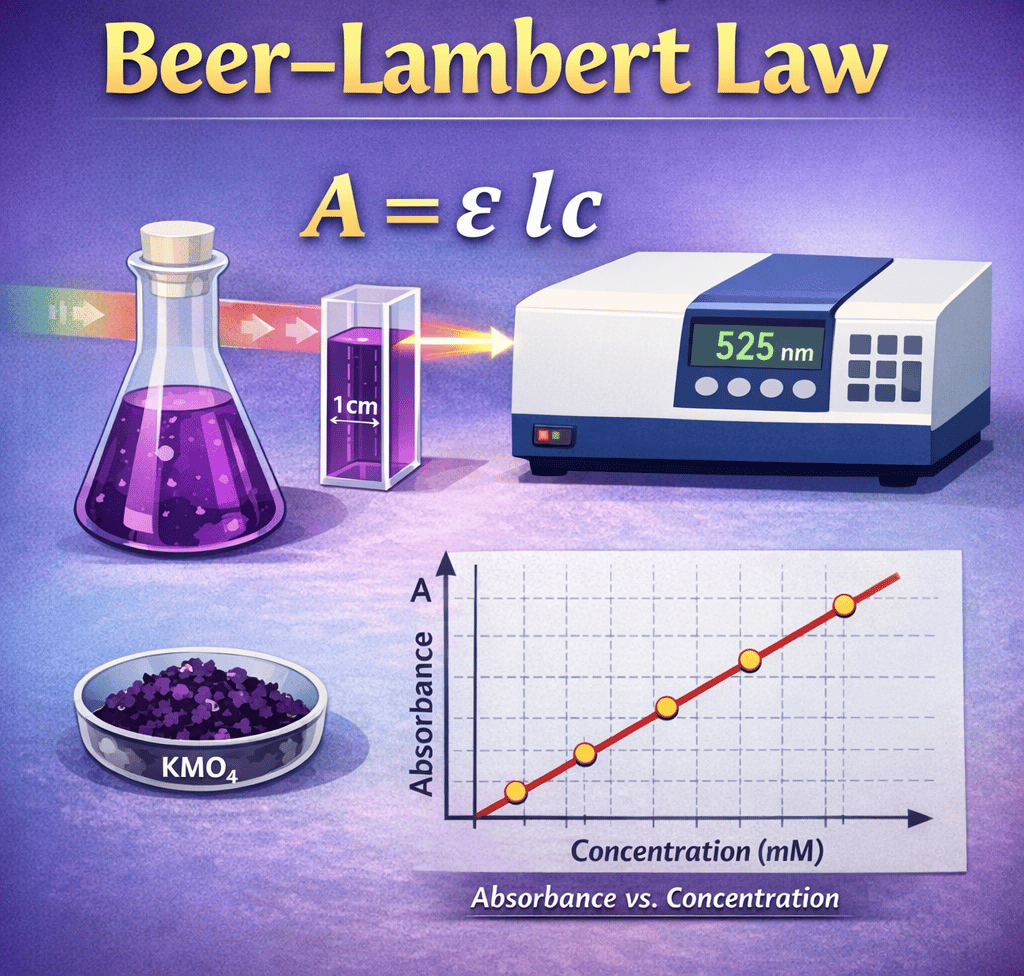
Estimation and Verification of Beer–Lambert Law
This cover captures the essence of spectrophotometric analysis through a clean and visually engaging scientific illustration. At the center, the fundamental equation A = εlc represents the core principle of the Beer–Lambert Law, highlighting the relationship between absorbance, molar absorptivity, path length, and concentration. A conical flask filled with deep purple potassium permanganate solution symbolizes the absorbing medium, while a transparent 1 cm cuvette demonstrates the standard optical path length used in UV–Visible spectroscopy. A beam of monochromatic light passing through the solution toward a spectrophotometer set at 525 nm emphasizes the importance of wavelength selection (λmax) in analytical measurements. At the bottom, a calibration curve showing a straight-line relationship between absorbance and concentration visually reinforces the law’s linear nature within its valid range. Overall, the cover blends theory and laboratory practice, making it ideal for BSc and MSc students exploring the practical verification of the Beer–Lambert Law in analytical chemistry and biochemistry experiments.
PROTOCOLS
Dr. Mainak Mukhopadhyay
2/17/20261 min read
Explore
Stay updated with biotech insights and research.
Connect
Discover
m.mukhopadhyay1212@gmail.com
+91-8777294577
© 2025. All rights reserved.